Jun 23, 2025

“An accurate estimate of intrinsic value is the essential foundation for steady, unemotional and potentially profitable investing.”― Howard Marks
Introduction
Circle’s landmark listing on public markets underscores a surging institutional appetite for regulated crypto infrastructure. The valuation will remain defensible only if its principal revenue engine continues to expand alongside USDC total supply.
This essay moves from narrative to measurement. More than 95% of the firm’s top line originates from these channels, which makes Circle highly sensitive to both short-term rates and the absolute quantity of USDC outstanding. We begin with a structural decomposition of the USDC supply curve, examining chain-level concentration shifts, relative capital velocities, and regime-specific inflection points to pinpoint the variables that most reliably accelerate mint activity.
Next, we introduce a recalibrating auto-regressive model that forecasts weekly supply with an error band of roughly ±1.5%, translating incremental expansion directly into EBITDA sensitivity.
As a coda, we demonstrate how this supply metric can be used as live tradable signal, giving market participants a real-time proxy for Circle’s fundamentals.
Structural analysis of CRCL multiples
At $58.2B market valuation, Circle's P/E multiple now exceeds almost 8 times that of Visa (~15x). High-profile conviction from firms like ARK Invest and BlackRock suggests that investors are not just pricing in present-day fundamentals. It reflects a forward-looking thesis grounded in potential of true mass adoption.
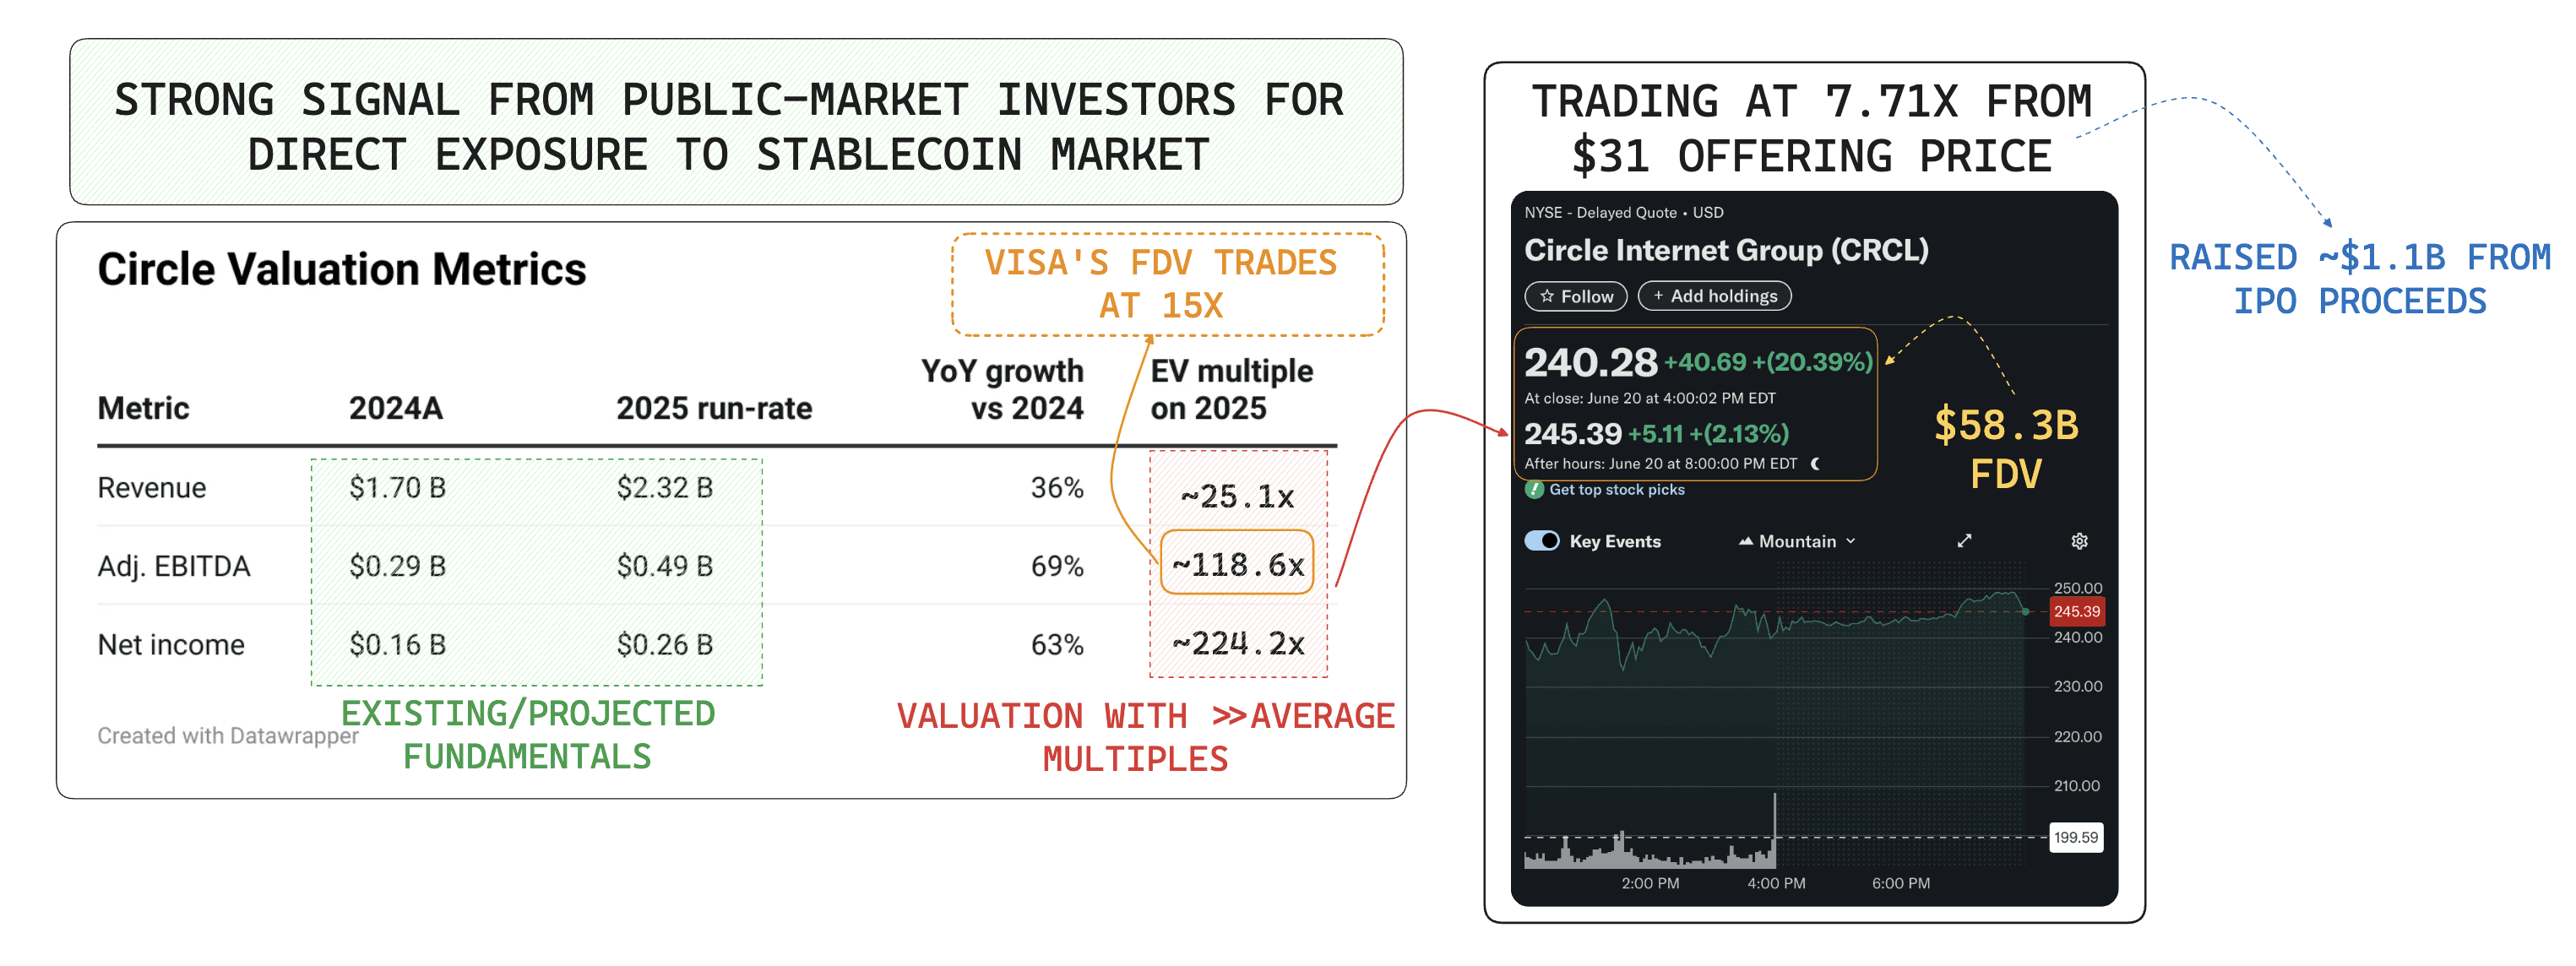
Circle Valuation Metrics & Ticker Screen - Source: Yahoo Finance
In order to sustain the valuation, Circle needs to continue showing a strong earning trajectory. Historically, 95%+ of Circle’s revenue comes from interest & dividends earned on the fiat assets that collateralise its stablecoins (cash at banks, short-term U.S. Treasuries, the BlackRock-managed Circle Reserve Fund). Therefore it is highly sensitive to short-term rates and to USDC in circulation.
Period | Adjusted EBITDA | 3 months T-bill Rates | USDC Total Supply |
|---|---|---|---|
FY 2022 | $96mm | 0.10% | $43.1B |
FY 2023 | $395mm | 4.40% | $44.3B |
FY 2024 | $285mm | 5.20% | $24.2B |
Q1 2025 | $122mm | 4.23% | $59.4B |
Source: SEC
Breaking down the EBITDA sensitivity:

where:
Net Interest Margin (NIM): Interest earned from yield-bearing reserve assets (e.g. T-bills)
Supply Flow-Based Fee: Fees generated from USDC mints and redemptions
As Fed rate cuts approach and NIM compresses, the market is pricing in a transition where its volume-based, transaction-linked revenue scales faster than rate compression.
This hinges on the continued adoption of USDC as a global payment network, where fee capture scales with usage velocity, cross-border flows, and ecosystem integration. That’s why studying USDC supply dynamics is essential. It acts as both a leading indicator and a valuation anchor for Circle’s future revenue streams, offering real-time insight into the evolving foundation of its business model.
The Stablecoin Supply Dynamics
Total stablecoin supply has now climbed to $251 billion, a new all-time high and a 34% increase over the previous cycle peak of $187 billion in 2021. This growth reflects meaningful capital inflow and renewed confidence in the crypto ecosystem.

Overall Stablecoin Historical Supply - Source: Defillama
Today, USDT and USDC account for over 86% of total stablecoin supply, with USDT leading with 62.1% and USDC following at 24.2%. Both play foundational roles across different ecosystems. USDC’s trajectory, in particular, offers a more transparent lens into regulated, institutional-grade demand.
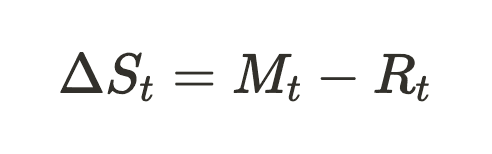
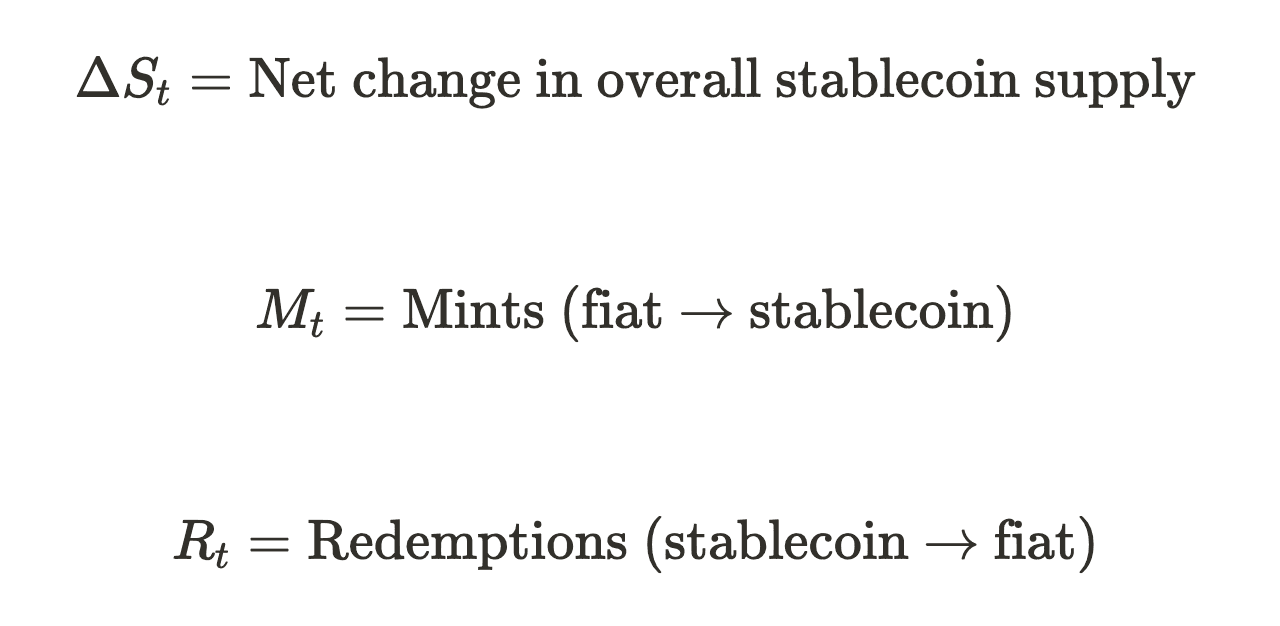
To understand how supply behaves across market cycles, we start with a simple supply flow equation:
where:
Driver | Proxy metric | Intuition |
|---|---|---|
On-chain real yield-spread | ETH-staking APR – 3-month T-bill | Higher spread → more basis & carry trades → higher mint |
Perp / futures basis | BTC, ETH annualised basis | Basis > funding cost → arbitrageurs mint to deploy collateral |
Treasury / corporate treasuries | Circle treasury inflow reports | Corporations mint for on-chain liquidity, reverse when cash is needed |
Macro risk appetite | VIX, MOVE, DXY | Flight-to-USD sees redemptions; crypto-risk-on sees mints |
This dynamic captures the essential dynamics behind stablecoin supply:
Expansion: When mints exceed redemptions
Contraction: When redemptions outpace mints
Viewing USDC’s history from the lens of expansion and contractions, we can see that it is shaped by major inflection points across the broader crypto timeline.

Source: Glassnode
Phase | Description |
|---|---|
Genesis & Slow Build | • Seeded by Coinbase and Circle, with early fiat gateway roles on Bitfinex and Poloniex. |
DeFi Summer Liftoff | • USDC demand surges via Compound’s “Yield Farming 1.0” and Curve’s Voting Escrow model incentives. |
2021 Bull-Market Expansion | • Perpetual funding trades, GBTC arbitrage, CeFi desk growth. |
Plateau & Early Cracks | • Collapse of Terra/UST halts mint activity and risk-on behaviour. |
Drawdown & De-Peg Phase | • CeFi failures (Celsius, FTX), Binance’s BUSD delisting, and the SVB crisis trigger USDC redemptions. |
Post-Crisis Recovery | • ETH staking yield normalizes. |
2025 Expansion Phase | • Spot BTC ETF launches drive capital inflows while treasury bill yields remain attractive. |
Accelerating Expansion (2025 and beyond)
With Circle’s IPO, USDC currently sits at an all-time high of $61.2 billion in circulating supply. This scale reflects its evolution from a simple transactional stablecoin to a recognised core financial primitive. Since 2021:
Average daily transaction volume is up 406%, rising from $7.77 billion to $31.52 billion
Daily active users have grown at a 142.92% CAGR since 2020, reflecting rapid adoption across ecosystems
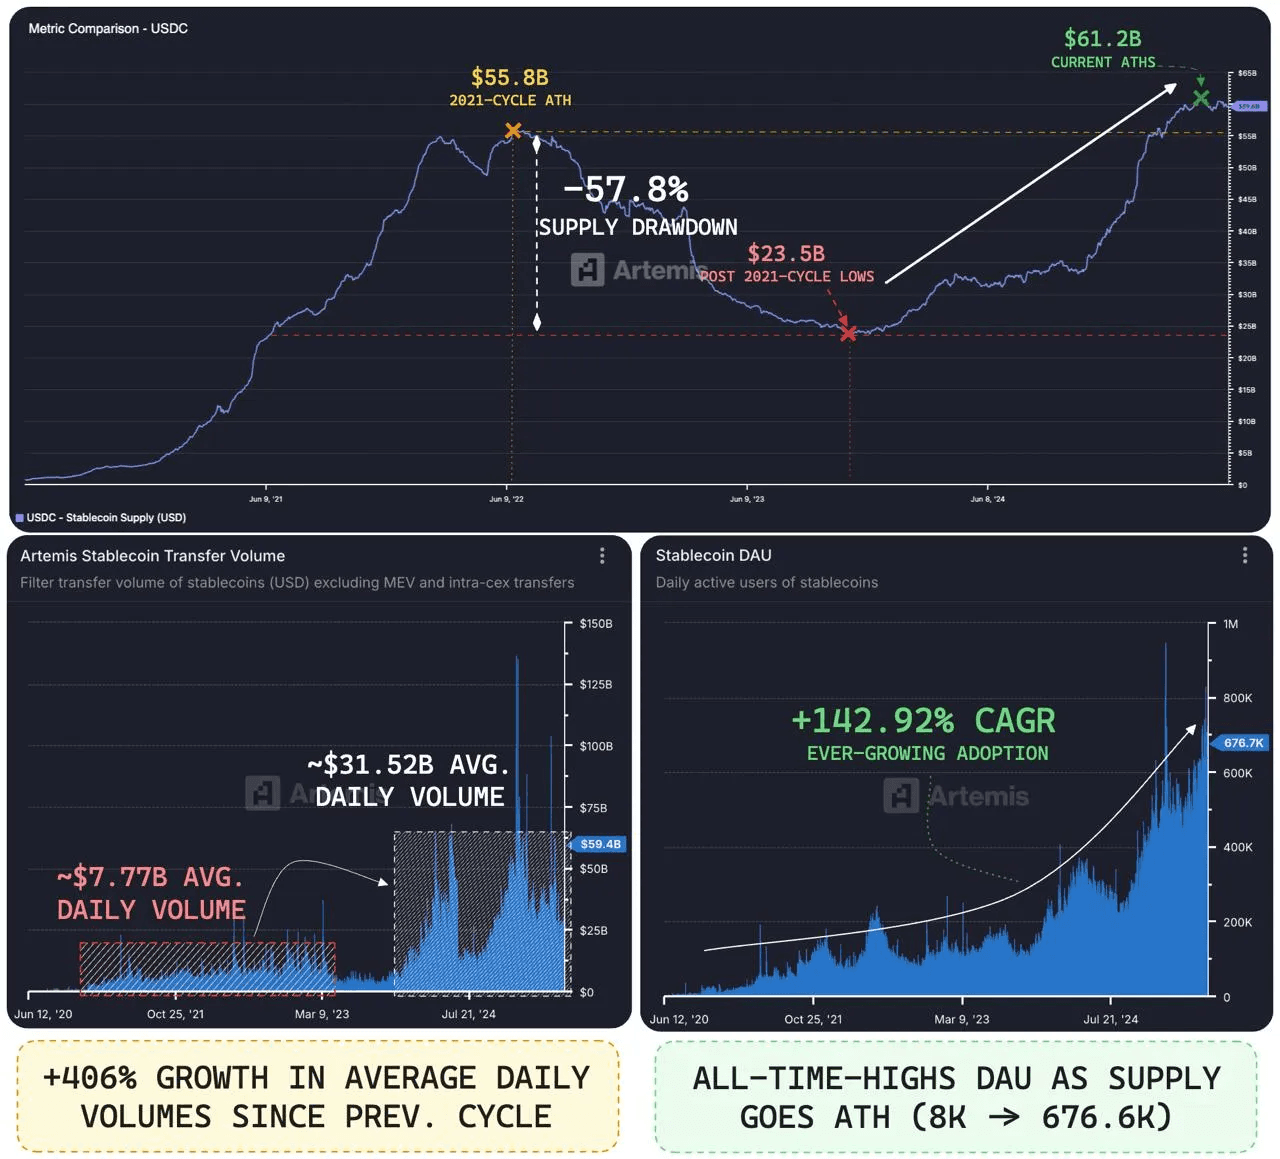
Circle USDC Metrics - Source: Artemisxyz
Moreover, the growth is also largely fuelled by strong demand driven by three reinforcing forces:
DeFi resurgence with renewed interest and participation from crypto-native audience
Emerging adoption from the broader TradFi audience in settlement, cash management, and treasury
Strategic alliance with Coinbase, offering direct access to one of the world’s largest crypto user bases. This partnership gives USDC an unmatched distribution advantage across retail, institutional, and on-chain ecosystems.
Capital Efficiency Tells the Real Story
Supply alone doesn’t show how hard each unit is working. It’s also important to recognise that a stablecoin’s real utility lies in how productive it moves.
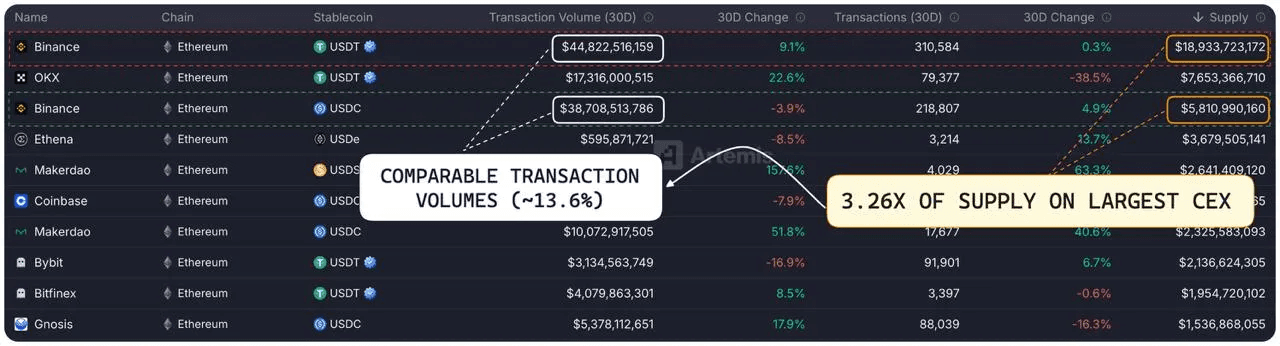
Stablecoin Volumes on CEXs - Source: Artemisxyz
On Binance, USDT remains the dominant stablecoin by supply, with $18.9 billion currently on the platform. In comparison, USDC holds just $5.81 billion, roughly one-third the size.
However, upon further inspection of transaction volumes, the gap nearly disappears. Over the past 30 days, USDT recorded $44.8 billion in volume, while $USDC reached $38.7 billion.
That is just 13.6% behind, despite the much smaller float.
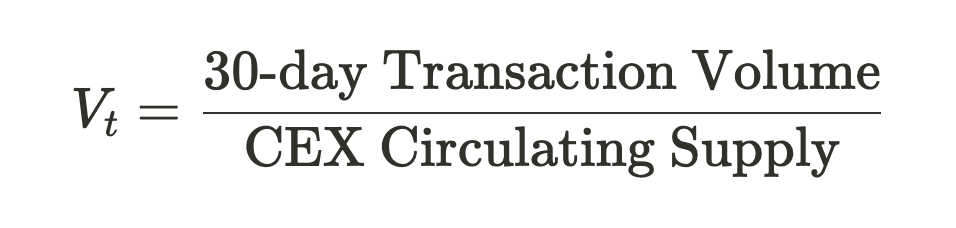
To quantify capital efficiency, we look at velocity (Vt) calculated as 30-day transaction volume divided by circulating supply:
Applying this to both USDT and USDC:
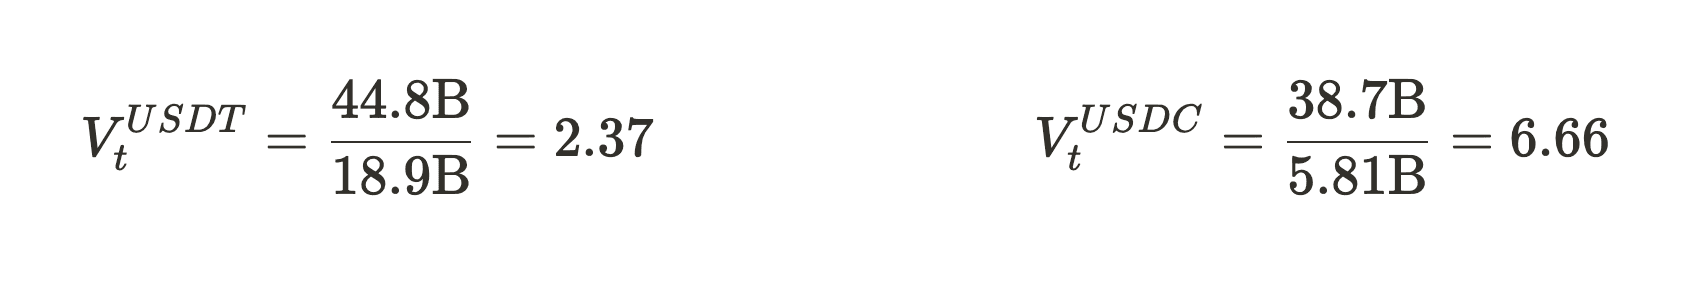
Source: Defillama, Visaonchain
This shows that USDC has 2.81 times higher capital velocity than USDT, meaning each dollar of USDC is transacted almost more than thrice as often. In short, USDC’s capital is moving faster, working harder, and signalling deeper on-chain utility.
Chain-Level Growth: Concentration in Alt-VMs & Layer 2s
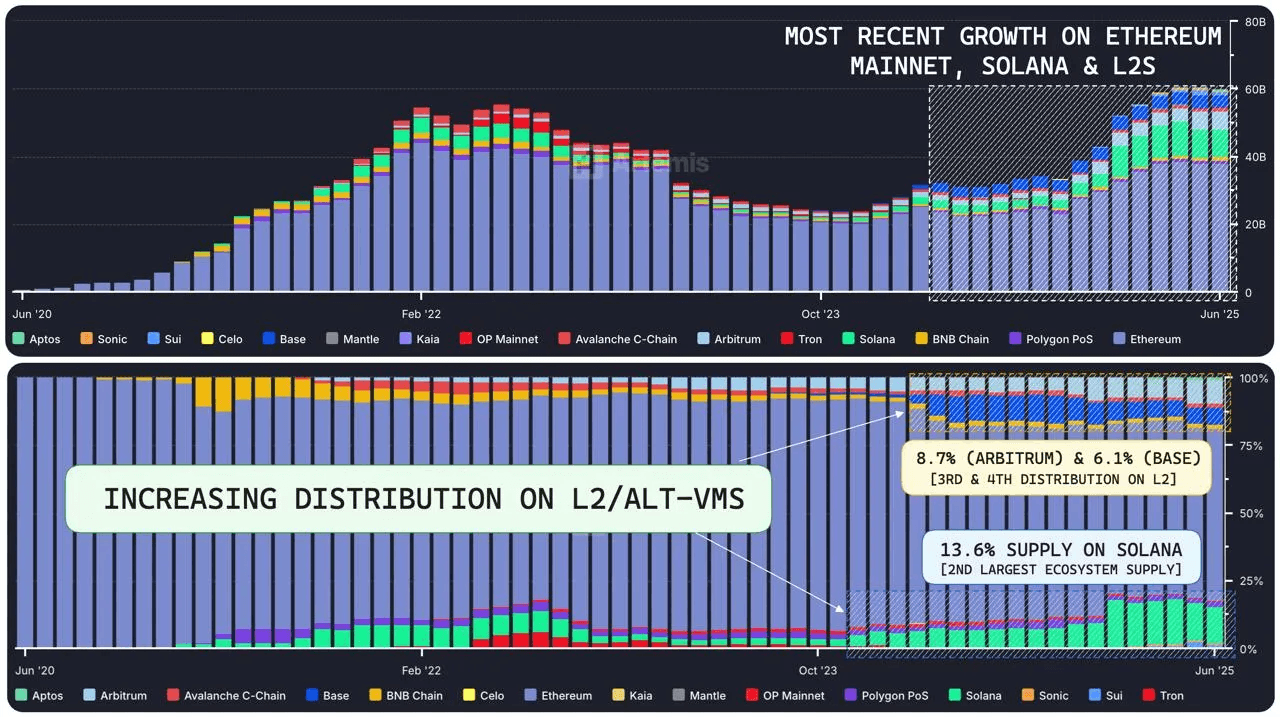
Circle USDC Historical Supply Chain Breakdown - Source: Artemisxyz
Recent USDC supply growth has shifted from its ‘primarily Ethereum-centric’ origins toward a more horizontally distributed footprint across Solana, Ethereum Layer 2s, and emerging alt-VM chains.

Current Circle USDC Supply Breakdown - Source: Artemisxyz
The breakdown shows how the supply is increasingly horizontally distributed across a diverse set of ecosystems, aligning with where liquidity, settlement demand, and on-chain utility are scaling fastest.
Solana is Dominated by USDC

Circle USDC Historical Volume on Solana - Source: Artemisxyz
In May 2024, it accounted for 99.5% of all stablecoin volume on Solana. Even as activity diversified in December, USDC still maintained a dominant 96% share.
On Arbitrum, a Flippening Already Happened
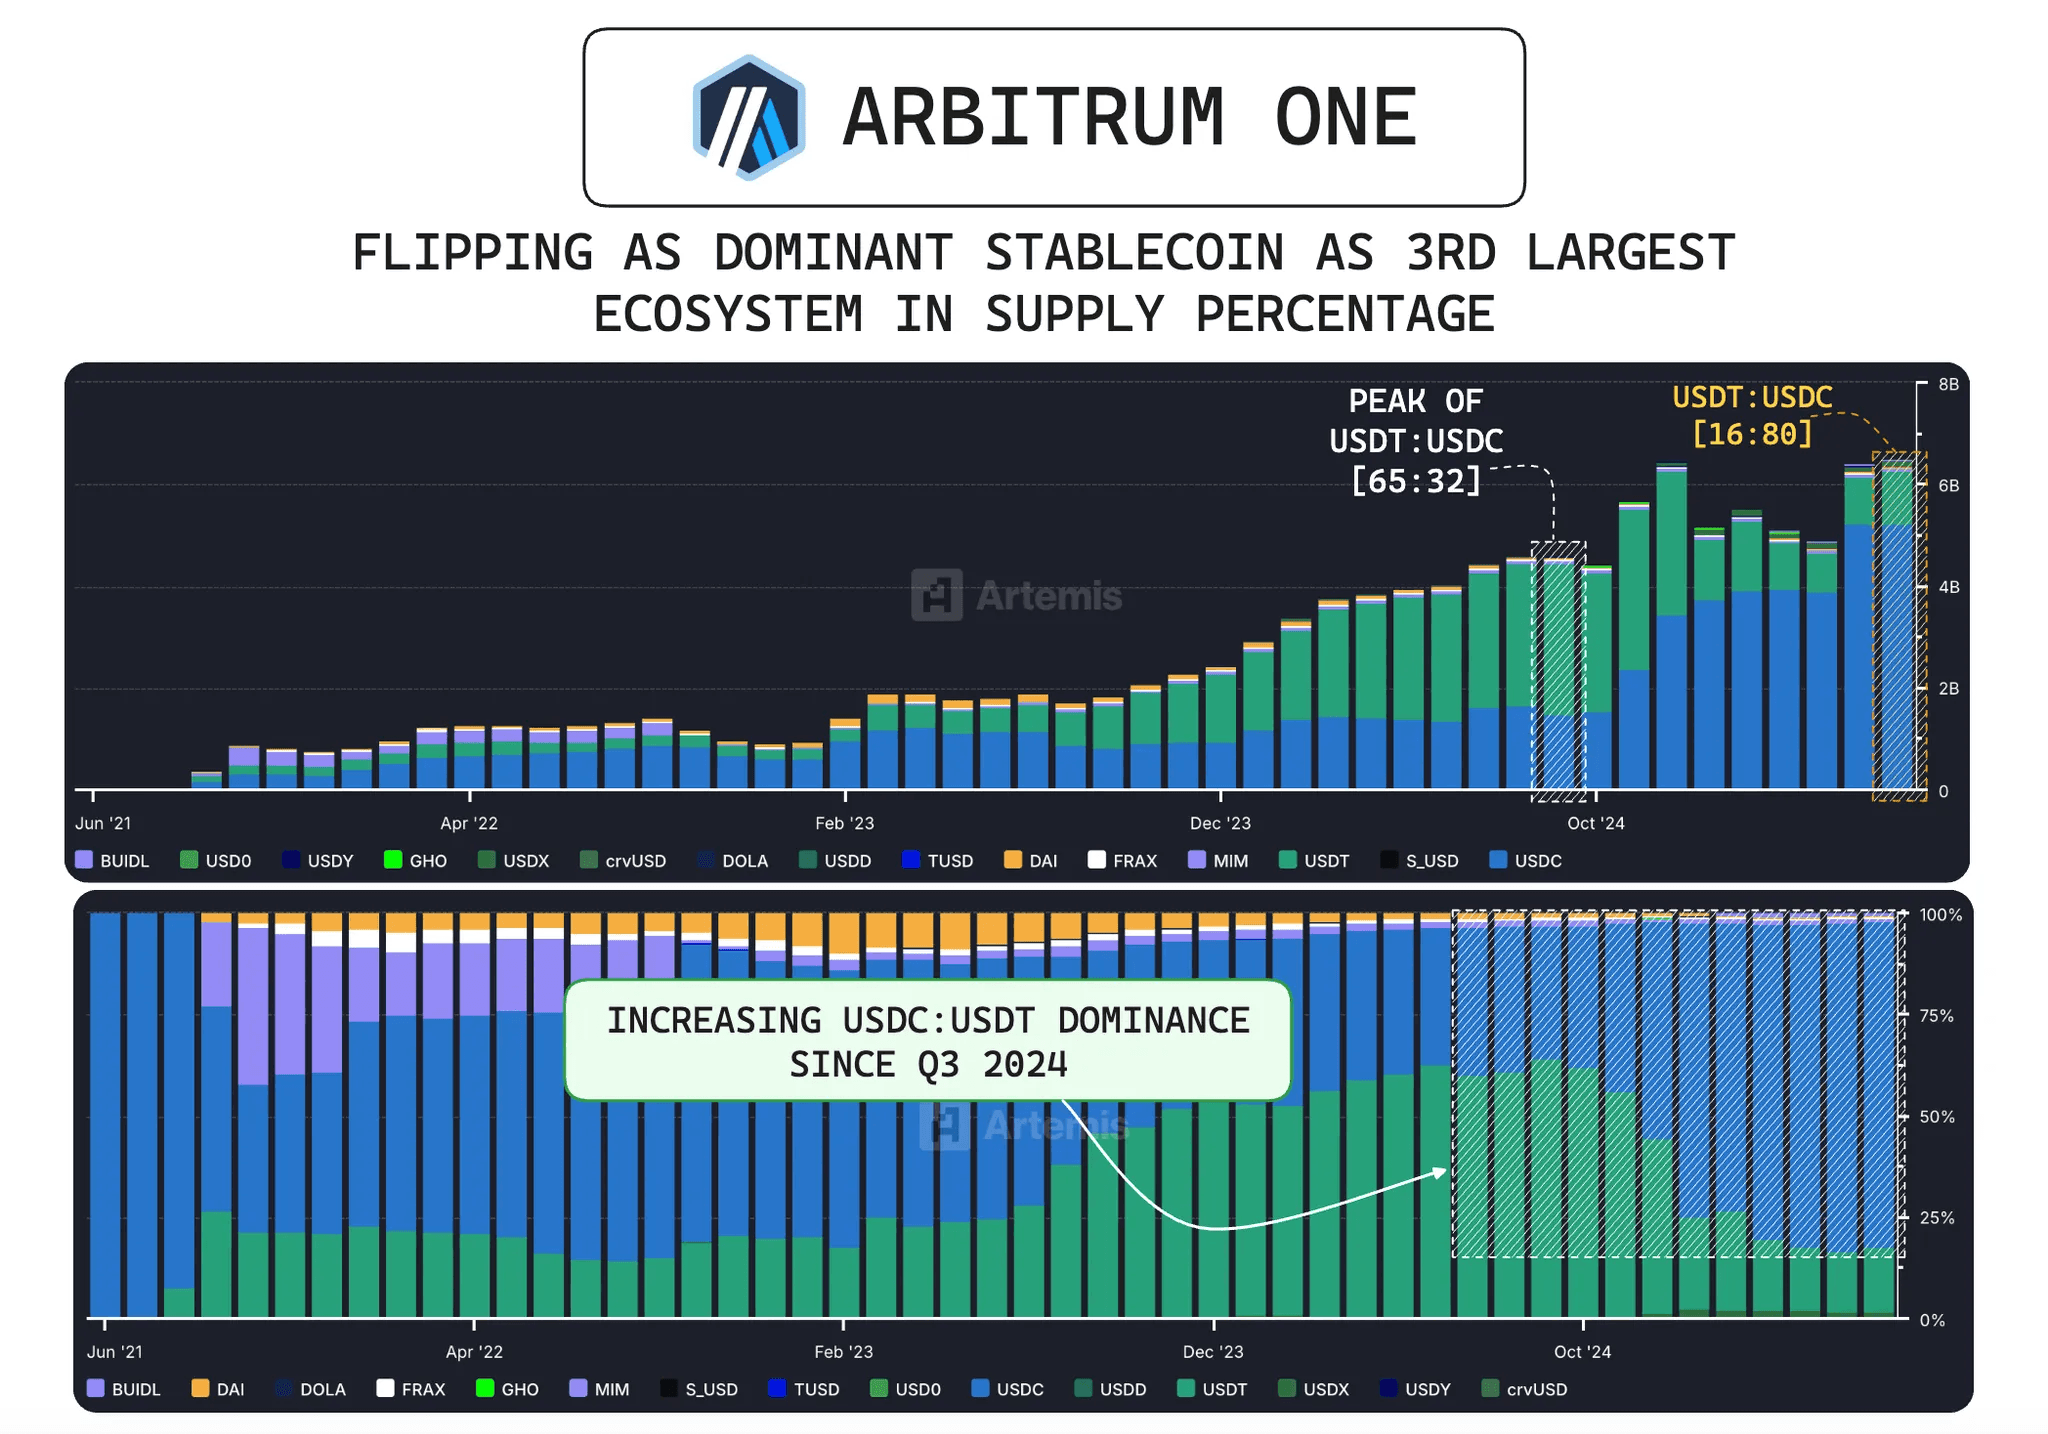
Circle USDC Historical Supply on ArbitrumOne - Source: Artemisxyz
In September 2024, a quiet but pivotal shift occurred where USDC overtook USDT as the dominant stablecoin on Arbitrum.
At its peak, the USDT-to-USDC ratio stood at 2.03 meaning Tether was over twice as prevalent. Today, that ratio has collapsed to just 0.2.

Hyperliquid Bridge Historical USDC TVL - Source: DefiLlama
Notably, this flippening has been largely driven by the explosive growth of Hyperliquid, which surged by 417% from $600 million in Q4 2024 to $2.5 billion by the end of Q1 2025. As of now, Hyperliquid’s bridge deposits has hit a new all-time high with $3.62 billion in TVL, marking a 601% increase from its Q4 base.
This shift reflects a unique structural alignment between Arbitrum’s core ecosystem and expanding integrations on top of it, creating the conditions for stablecoin dominance trends like this.
Quantitative model on USDC Supply Curve
Given the significance of USDC supply dynamics, we built an auto-regressive model to predict USDC’s total supply. We choose AR model because of its simplicity, transparency and good performance for USDC supply curve's local linear growth pattern.
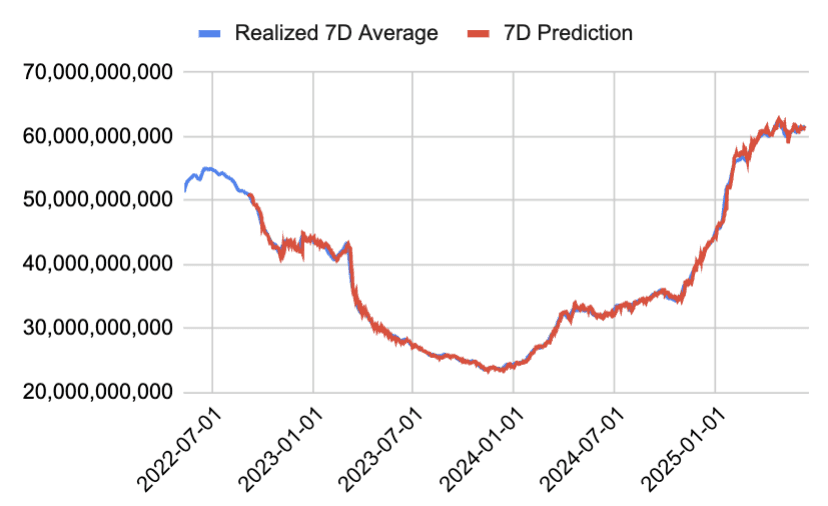
Source: internal model
The model re-calibrates every 90 days to capture the latest momentum while assuring the number of sample for regression/matrix calculation is robust. Each forecast horizon has its own dedicated model, trained on a 90-day sliding window (7 independent regressions, each with a unique set of beta coefficients). The model uses trailing moving averages (1-day, 3-day, 7-day, 14-day, and 30-day) as features, to predict the n-day forward average of USDC supply, where n ranges from 1 to 7. The regression constant is set to zero, allowing the model to stay fully signal-driven.
The approach is highly effective at predicting short-term directional shifts in supply. Since 2022, there has been an 80% chance where the realized 7-day average USDC total supply is within ±1.5% of the prediction outcome.

Source: internal model
Final Thoughts
Circle’s IPO marks a major inflection point for the crypto industry. More than just a capital raise, it signaled strong, previously unmet demand for stablecoin exposure in public markets. The performance underscores deep investor interest in compliant digital dollar infrastructure, positioning Circle as the clearest public proxy for this rapidly emerging asset class.
At a $58.2 billion valuation, Circle now stands as the institutional gateway to regulated digital liquidity with USDC at the center. As USDC becomes increasingly embedded across both the expanding DeFi ecosystem and traditional financial systems, its role is evolving. It no longer merely tracks adoption. Its supply dynamics now serve as a real-time barometer for global liquidity that reflects capital flows, risk sentiment, and market positioning.
Up until this point, the only way to bet on this growth was by trading Circle stock, where stock-specific factors obscure the underlying dynamics. Alkimiya’s total supply market strips those out and delivers clean exposure to the monetary base of USDC.
Read Introducing USDC Supply Market.
Alkimiya is a universal markets protocol for trading fundamentals. It lets traders transform real-world metrics, e.g. macro indices, commodities, on-chain revenues, blockspace, into liquid prediction markets.
Learn more about Alkimiya: Website | Docs
Join our community: Twitter | Discord